This paper was presented at the 101st TRB Annual Meeting and published in the Transportation Research Record: Journal of the Transportation Research Board.
ABSTRACT
This paper investigates the performance of timber trestle railroad bridges through field tests on aging open deck and ballast-deck bridges. This study also develops non-parametric deterioration models based on Average Time In Condition Rating (ATICR) and Kaplan-Meier (K-M) estimates to assess the performance of timber highway bridge components using the National Bridge Inventory (NBI) data. This study proposes ATICR-based deterioration models for predicting the condition of timber bridge components. The study shows that the average service life of timber multi-beam bridge components under routine maintenance without any reconstruction or rehabilitation is obtained as 23 years for decks, 26 years for the superstructures and 27 years for the substructure components of timber multi-beam highway bridges. K-M estimate-based reliability models are developed for probabilistic prediction of bridge safety while accounting for partial information from incomplete bridge condition observations. Based on the K-M reliability models, the Median Survival Year (MSY) which refers to the number of years for which 50% of the bridge population remains in its current condition without deterioration is obtained as 10 years for the decks, 14 years for the superstructures and 12 years for the substructures of timber multi-beam bridges. The models also suggest that there is a 80% chance that the timber bridge components will remain in their current condition without deterioration to a lower condition for a minimum of 3 years. The analysis carried out in this paper will help improve the understanding of managing or maintaining a number of timber bridges that are currently in operation worldwide.
INTRODUCTION
Timber has been a major source of structural material for the railroads since the beginning of railway history in the US owing to its desirable properties such as strength, light weight, and energy-absorbing characteristics (1). The timber bridge components have already exceeded their traditionally accepted life span of 50 years in many locations (2). Hence, routine bridge inspections, periodic assessments and maintenance are necessary to ensure the safety of aging bridges. Figure 1 shows the various structural components of a typical open-deck Timber Railroad Bridge (3).
Several studies have been carried-out by various engineers and researchers to evaluate and rate the condition of existing timber railroad bridges based on analytical methods, field load tests and laboratory load tests. Ray et. al. (1998) provided uniformity in the procedures and policies for determining the load capacity of bridges on U.S. Army Installations (4). Wipf et. al. (1996) conducted a research to measure and quantify the static and dynamic load distribution characteristics of the D’Hanis bridge using field tests and developed an analytical model of the bridge to further study the static load behavior (5). Gutkowski (2001, 2002) conducted a field load test program to evaluate three open-deck timber railroad trestle bridges under static loads, ramp loads, moving train loads. The responses of the bridges to various loadings were compared to the predicted responses from several analytical modeling assumptions (6,7). Moreu et al. (2014) investigated the effect of traffic on timber railroad bridges to capture the critical changes in timber railroad bridge serviceability as a function of railroad loading, speed, and direction (8). Nagarajan et.al. (2019) investigated non-contact deflection monitoring technique for measuring vertical and lateral displacements of timber trestle railroad bridges (9).
The American Railway Engineering and Maintenance-of-Way Association (AREMA) provides recommended practices for design, construction, and maintenance of railway infrastructure. AREMA 2015 Manual allows the vertical deflection of stringer for design purposes as L/500 where L is the span length (10). However, as per early 1900 design provisions (Jacoby, 1909), deflection is limited to 1/200 of the span for stringers in railroad bridges and trestles (11). The present study investigates the performance of aging timber railroad bridges based on field experiments on open-deck and ballast-deck bridges located in Florida.
In order to assess the performance of timber highway bridges, the present study utilizes National Bridge Inventory (NBI) data to develop deterioration models and reliability models for timber bridge components. The NBI database maintained by the Federal Highway Administration (FHWA) comprises of routine bridge condition data based on visual inspections. The historic bridge inspection data is not publicly available for many of the timber railroad bridges perhaps because these bridges are privately owned. This study considers the bridge inspection data for about 850 timber multi-beam highway bridges in Florida based on NBI records from 1992 to 2019 to develop non-parametric deterioration models for bridge performance assessment.
The two major causes for deterioration of timber bridges are decay of wood and mechanical damage. These causes lead to visible observable defects in timber bridge components such as cracks and section loss. Deterioration models are an excellent way of relating the factors causing deterioration and the observable defects (12-16). The present study proposes Average Time In Condition Rating (ATICR) based deterioration model for bridge condition prediction and assessment of deterioration rates. The reliability models developed in this study are based on Kaplan-Meier (K-M) estimates (17). Limited literature exists in the application of K-M models for bridge maintenance (18-22). K-M reliability models have unique advantages of not requiring any assumption on the functional form of the deterioration model and the ability to account for partial information from incomplete bridge condition observations for probabilistic prediction of bridge safety. The present study develops K-M reliability models for timber multi-beam bridge deck, superstructure, and substructure components for Florida highway bridges. Due to lack of availability of routine inspection records for railroad bridges, development of K-M survival models is not a feasible task. However, this paper suggests that the performance of timber trestle railroad bridges can be understood based on survival models developed for timber multi-beam highway bridges. The paper presents the discussions on the choice of multi-beam highway bridge data to understand the performance of timber trestle railroad bridge components. The analysis carried out in this paper will help improve the understanding of managing or maintaining a number of timber bridges that are currently in operation worldwide.
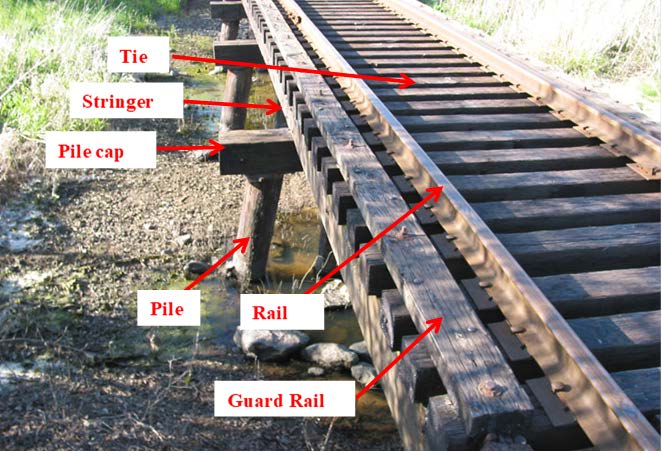
Figure 1. Open-deck timber trestle railroad bridge
METHODOLOGY FOR FIELD TESTS AND DEVELOPMENT OF DETERIORATION MODELS
The performance of timber trestle railroad bridges are assessed based on field tests conducted in the present study. The performance of timber multi-beam highway bridges over the years are assessed based on the deterioration models developed in this research. Two types of non-parametric deterioration models are proposed in this paper: i) Average Time In Condition Rating (ATICR)-based models and ii) Kaplan-Meier Reliability Models. Non-parametric deterioration models have an advantage of not requiring any assumption on the functional form of the model and is solely based on the bridge inspection data. The methodology for field tests and development of deterioration models are shown in Figure 2.
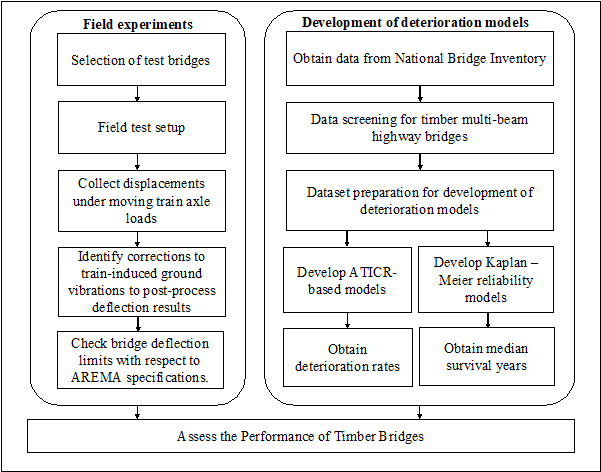
Figure 2. Methodology for field tests and development of deterioration models
FIELD EXPERIMENTS ON TIMBER TRESTLE RAILROAD BRIDGES
Choice of Test Bridges
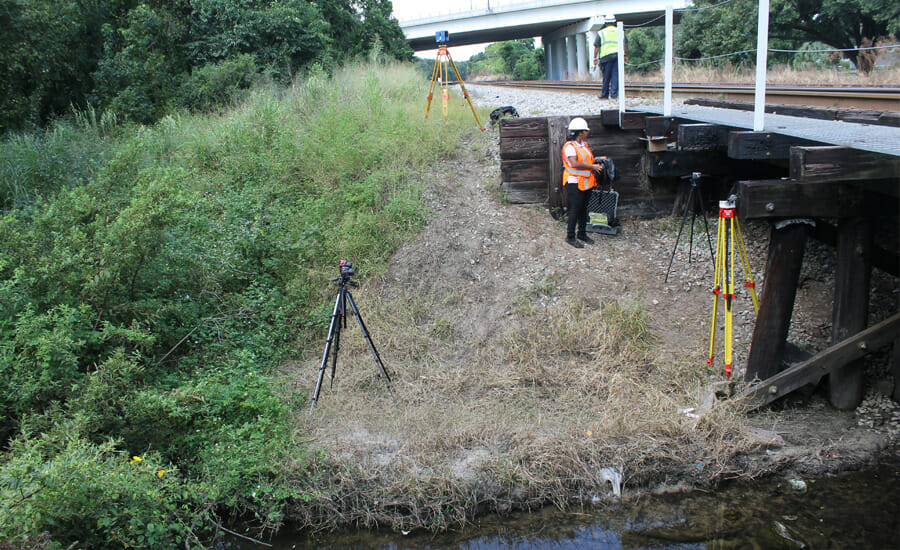
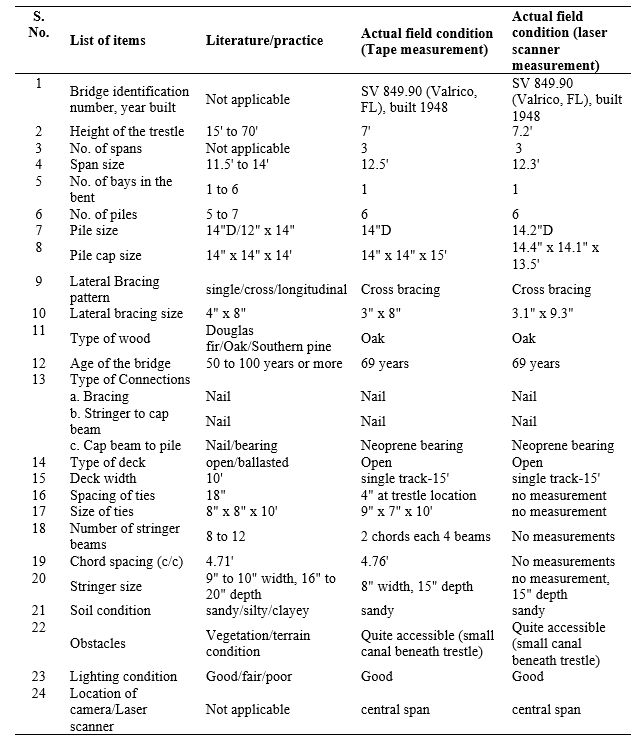
Site visits were made to two representative timber trestle railroad bridges located near Bartow, Florida (FL) that were identified by the Chessie Seaboard Consolidated (CSX) Transportation: i) Site 1- an open-deck bridge built in 1948 and ii) Site 2 – a ballast deck bridge built in 1957. The selection of bridges was based on the accessibility and lighting conditions. The summary of data collection for the open deck timber railroad bridge is shown in Table 1 (9). Similar data was collected for the ballast-deck railroad bridge.
Table 1. Summary of data collection for open deck timber 3-span trestle rail-road bridge
Field test set-up and data collection under moving train loads
The field test set-up consisted of a laser scanner, cameras and deflectometers as shown in Figure 3a. Laser scanner was used to obtain the 3D point cloud of the bridge. Cameras were utilized to record the deflectometer readings during the passage of train. Two deflectometers were set-up – one at the midspan of the bridge to measure the vertical deformation of the stringer due to the moving train axle loads and another at the pile/pile cap to measure its lateral displacement. Deflection data were collected due to moving train loads: CSX freight train (Figure 3b) on the open deck bridge and Amtrak passenger train on the ballast-deck bridge. The location of the axle loads causing maximum deflection at the midspan is shown in Figure 3c.
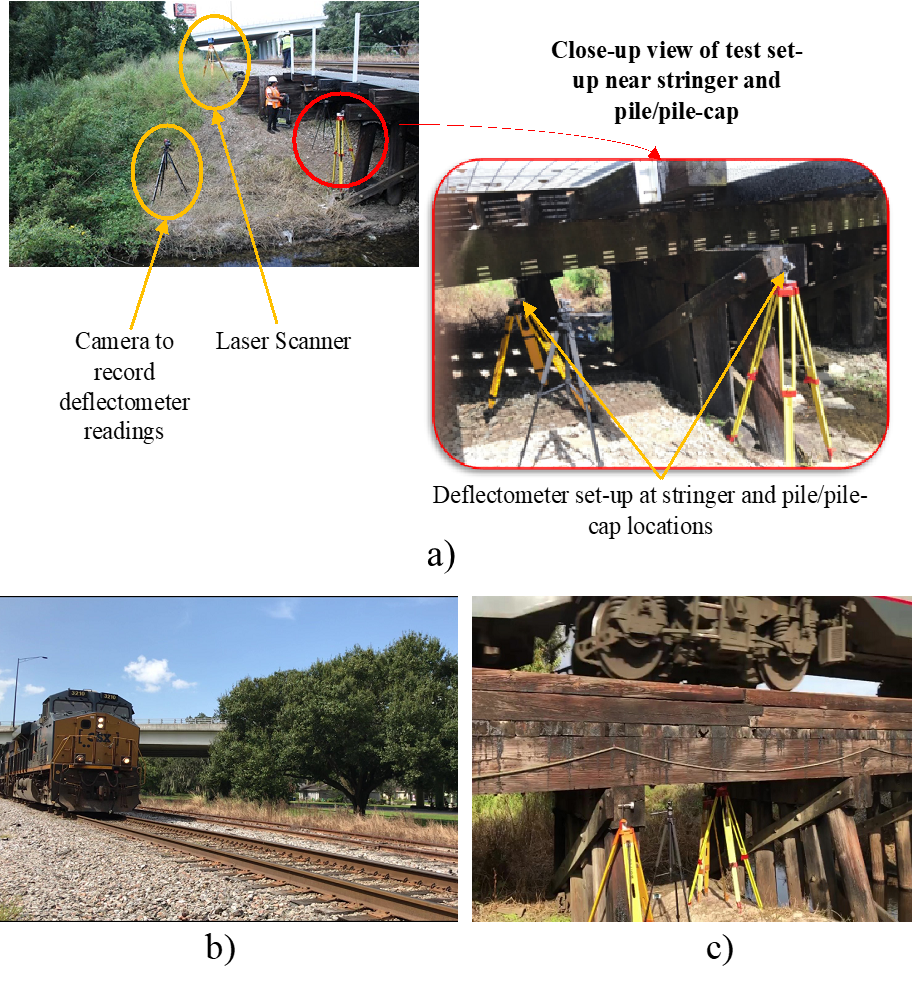
Figure 3. a) Field test set-up; b) CSX freight train at site 1; c) Amtrak train axle loading location causing maximum mid-span deflection at site 2
Correction to train-induced ground vibrations and post-processing deflection results
The motion of the train induces ground-vibration. Hence correction to the vertical deflection of stringer and lateral displacement of pile should be applied. The cameras were positioned approximately 6 ft and 1 ft away from the bridge for recording the vertical and lateral displacements respectively. Based on the published literature by Cardona et. al. (2010), the projected overall displacement at a distance of 1 ft – 6 ft from the vibration source is approximately ±1 mm to ± 0.5 mm (23).
Deflection limits
The deflection limits of bridges considered in this study: open deck bridge of span 12.5’ feet and ballast deck bridge of span 11.5’, are 7.6 mm and 7 mm respectively based on the recent AREMA specifications. Based on the early 1900 design provisions, the deflection limits are 19.1 mm for the open deck bridge and 17.5 mm for the ballast deck bridge.
PERFORMANCE OF AGING TIMBER MULTI-BEAM HIGHWAY BRIDGES
The performance of aging timber multi-beam bridges is assessed using the Average Time In Condition Rating (ATICR)-based deterioration models and the Kaplan-Meier (K-M) reliability models developed in this study. The ATICR models enable the identification of deterioration rates for the timber bridge components. K-M reliability models are developed for probabilistic prediction of bridge safety while accounting for partial information from censored bridge condition observations (24).
National Bridge Inventory Data
The National Bridge Inventory provides a wealth of information on the bridges in the US and their conditions recorded based on routine bridge inspections. The NBI database provides the condition rating of three primary components of the bridge – Deck, Superstructure and Substructure. NBI has bridge component rating scale of 0-9 and follows a meaningful trend, i.e., the highest rating scale 9 is associated with the best/new condition to lowest condition rating 0 implies failed condition (25). The difference in the rating scales is gradual and associated with a gradual decrease in the bridge component condition expressed in terms of the extent of cracking or material degradation (12, 13,16).
Data screening
The data is screened after extracting the required input variables for the study so as to exclude duplicate records and any unrealistic condition records. In order to have accurate deterioration models, those bridges whose condition ratings have improved over the years due to reconstruction are identified and treated separately (26). Only records with condition ratings from 9 to 4 (excellent to poor condition) are considered in this study for model development since in the general practice, bridge engineers take corrective measures to prevent deterioration beyond poor condition 4 in order to ensure public safety.
Dataset preparation
The dataset preparation involves identifying the censored observations and the number of years that the timber bridge components remain in a given condition rating (also called as Time In Condition Rating (TICR)) by each bridge in the dataset. About 850 timber bridges are considered in the study. Figure 4 shows the types of censoring observed in bridge condition inspection records. Censoring refers to missing information about the event in the inspection. The term ‘event’ herein refers to the condition deterioration of the bridge component. The result of ignoring these ‘censored observations’ is an underestimation of the probability of survival beyond the fixed time-point (27). Uncensored dataset refers to the complete set of observations within the observation period that includes at least one event during that period.
There are three types of censoring that occurs in bridge inspection records: right-censoring, left-censoring, and interval-censoring.
- A dataset is termed as left censored if the records do not contain information on when the event (i.e. condition deterioration) has occurred before the start of bridge inspection data collection. For example, if the bridge condition is observed starting from only 10 years after its original construction, there is missing condition information until that time.
- A dataset is termed as right censored if the event is not observed during the observation period.
- If it is known that the condition of the bridge has been deteriorated within the observation period, but it is not known as to when it has occurred, such observations are termed as interval censored. In addition, any missing inspection condition within the observation period is considered as interval censored.
The Kaplan-Meier estimate is the simplest way of computing the survival (or reliability) over time in spite of all these difficulties associated with the above-mentioned situations (Manish et al, 2010). The ability to utilize the partial information from the censored observations is the main contribution of K-M reliability models.
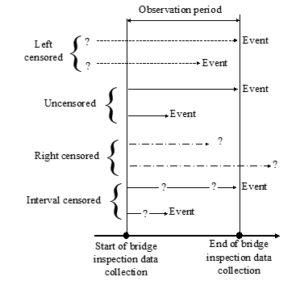
Figure 4. Types of censoring in bridge inspection records
Development of Average Time-In-Condition Rating (ATICR)-based deterioration models
Based on TICR values for each bridge, the average TICR-based deterioration model is developed. Figure 5 shows the frequency distribution of the timber multi-beam bridges and the time in years that the bridge superstructure remained in condition ratings from 9 to 4. The deterioration models for the timber bridge deck, superstructure and substructure are developed based on the ATICR values.
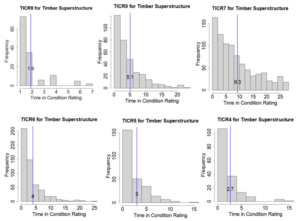
Figure 5. Timber multi-beam bridge superstructure TICR distribution for condition ratings 9 through 4
Deterioration rates
Using the average time in condition ratings (ATICR), the deterioration rates are calculated for the timber multi-beam type bridge components using equation (1):

Where, is the condition rating with i from 9 to 4; is the cumulative average time in condition rating corresponding to rating i. Based on the cumulative time in condition rating, the relative deterioration rates are computed. To the author’s knowledge, there are no published literature available on Average Time In Condition Rating (ATICR) based non-parametric deterioration model.
Development of Kaplan-Meier Reliability Models
The K-M estimate was originally proposed by Kaplan and Meier in 1958 to obtain nonparametric estimation from incomplete observations. Since then, it has been widely used in the medical research to measure the fraction of patients living for a certain amount of time after treatment. Limited studies exist in engineering applications and especially for bridge safety. These models essentially give the information on the percentage of bridge population that remained in their current condition (survived) without deterioration for every one-year time interval during the bridge condition observation period.
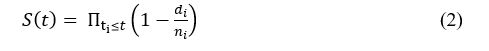
Kaplan-Meier estimator is a non-parametric statistic used to estimate the survival function from reliability data. The other names of reliability data include life data, failure-time data, survival data or event-time data. The Kaplan-Meier curve is the visual representation of the survival function that shows the probability of an event at every time interval. K-M estimate is a product estimator to calculate the survival function S(t) and is given by equation (2).
= rank-ordered survival times in a sample of n observations
= observed number of failures (bridges deteriorated from higher to lower condition) at
= number of bridges at risk of failing at
Median Survival Year (MSY)
Median survival is a statistic that refers to how long the bridges have stayed in its condition without deteriorating. It is the time (expressed in years) when half the bridge population are expected to be in its present condition without deterioration. In other words, it means that the chance of staying in its present condition without deterioration beyond that time is 50 percent.
Results and Discussions
The results of deflection behavior of timber trestle railroad bridges and the performance of timber multi-beam highway bridges based on non-parametric deterioration models are discussed in this section.
Field Deflection Results
The vertical displacement time-history at the midspan of the stringer (corrected for train-induced ground vibrations) for the open-deck and ballast-deck bridges are shown in Figures 6a and 6b respectively. A maximum vertical displacement of 13 mm at the midspan due to freight train engines and 5 mm due to freight cars are observed for the open-deck bridge. A maximum vertical deflection of 10 mm due to passenger train engines and 4 mm due to the cars are observed. After corrections to ground vibrations, a maximum lateral displacement of 1.5 mm was observed in the pile/pile cap of open deck bridge due to freight engines. In case of the ballast deck bridge, a maximum lateral displacement of 0.5 mm was observed.
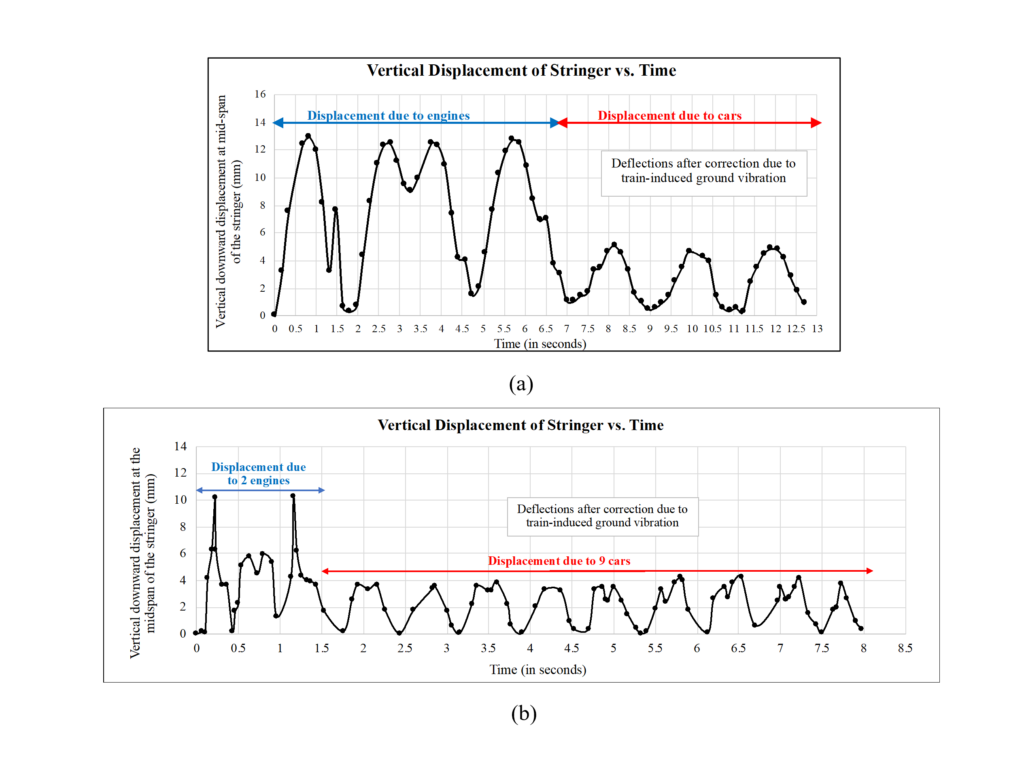
Figure 6. Vertical displacement at midspan of stringer: a) Open-deck bridge with CSX freight train, b) Ballasted-deck bridge with Amtrak passenger train
Deflection limits
The vertical deflections of both the open-deck and ballast-deck bridges exceed the current AREMA specifications. The vertical deflections are 5.4 mm and 3 mm more for open-deck bridge and ballast-deck bridge respectively when compared to the recommended deflection limits of 7.6 mm and 7 mm respectively. However, based on early 1900 design provisions, the deflections are well within the limits.
Condition Ratings
Since a majority of the railroad bridges are privately owned, routine bridge inspection records are not publicly available. Similar to the NBI condition ratings for the highway bridges administered by the FHWA, the railroad bridges are also inspected and assigned condition ratings by the railroad bridge owners such as CSX, Amtrak etc. The condition of the railroad bridges are rated in a scale of 1 – 5 with 5 corresponding to Good condition and no need for maintenance to 1 referring to poor condition with member requiring immediate repair or removal from service for safety consideration. A condition rating 2 refers to poor condition with need for continuous monitoring at each inspection and such structural members are considered for the maintenance program. A condition rating 3 refers that the structural members are functional with signs of deterioration and no maintenance is expected between inspection intervals. A condition rating 4 refers to satisfactory condition with only minor deterioration noted.
Based on the information shared by the railroad bridge engineers, the condition ratings of the bridges at the time of field tests conducted in the year 2018 were: i) 2 for the superstructure and 3 for the substructure of open deck bridge built in 1948 and ii) 4 for the superstructure and 2 for the substructure of the ballast-deck bridge built in 1957. The superstructure herein refers to the stringer beams and substructure refers to the intermediate driven bent consisting of pile cap and piles. It is important to note that the lowest of the condition ratings assigned to the members are reported here for the superstructure and substructure components. In order to perform further analysis and comparisons between the performance of highway and railroad bridges, routine inspection records for railroad bridges are necessary.
Deterioration models
This study proposes Average Time In Condition Rating (ATICR)-based model to obtain the deterioration rates of bridge components which aids in the bridge component condition prediction. The probabilistic prediction of bridge safety accounting for partial information from the incomplete bridge condition observations is obtained based on K-M reliability models.
Average Time-In-Condition Rating (ATICR) based Deterioration Models
The average time (in years) spent in a given condition rating by the timber multibeam bridge components for Florida bridges is shown in Table 2a. The deterioration rates from a higher to a lower condition are shown in Table 2b. It is observed that the deterioration rates are higher for condition rating from 5 to 4 which can be attributed to faster deterioration rate of older bridges. Figure 7 shows the ATICR-based deterioration model. The average service life of timber multi-beam bridge components under routine maintenance is obtained as 23 years for decks, 26 years for the superstructures and 27 years for the substructure components. Here, service life refers to the time (in years) taken for the bridge condition to deteriorate from excellent/new condition to poor/advanced section loss condition (i.e. from condition rating 9 to 4). It can be noted that a linear interpolation is assumed between the ATICR values in Figure 7, however, the ATICR values themselves are not based on any assumptions and are solely based on the bridge inspection records. Hence, the paper states it as a non-parametric model.
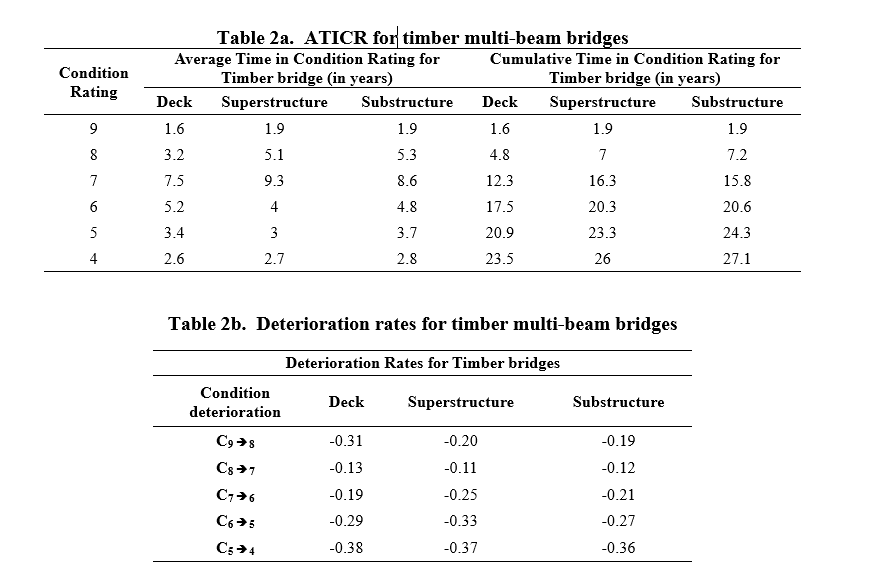
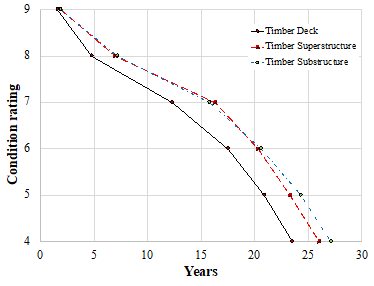
Figure 7. Timber multi-beam bridge ATICR-based deterioration model
It is observed that the time in condition ratings 8 and 7 is much longer than in the other condition ratings. Based on FHWA (1995), condition rating 8 corresponds to ‘Very good condition’ with no signs of deterioration. Condition 7 corresponds to ‘Good condition’ with some minor problems but without any deterioration of structural elements. The reason for the bridge components to stay for longer durations in conditions 8 and 7 is attributed to difficulty in assigning condition ratings and also the higher deterioration rates of bridge components during its initial and final stages of service life corresponding to condition states 9, 5 or 4 when compared to ratings 8 and 7 (Ref: Table 2b in the manuscript). Also, the routine bridge inspections and repair carried out on relatively younger bridges enable them to stay in very good/good condition state for a longer time.
Kaplan-Meier Reliability Models
K-M reliability models for the timber bridge deck, superstructure, and substructure components are shown in Figures 8(a-c). The Median Survival Year (MSY) which refers to the number of years for which 50% of the bridge population remains in its current condition without deterioration is obtained as 10 years for the decks, 14 years for the superstructures and 12 years for the substructures of timber multi-beam bridges. The models also suggest that there is 80% chance that the timber bridge components will remain in their current condition without deterioration to a lower condition for a minimum of 3 years.
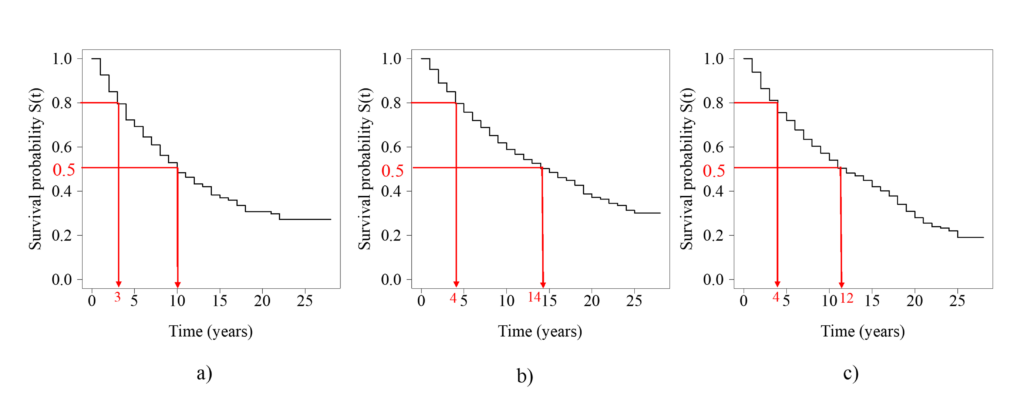
Figure 8: K-M models for Timber Highway Bridge Components: a) Deck, b) Superstructure and c) Substructure
In order to check any trends in the NBI data based on construction year, further analysis is carried out for the timber multi-beam highway bridge deck, superstructure, and substructure components. Figure 9 shows the K-M survival models for Timber multi-beam bridge components for three groups of bridges based on their year of construction: i) 1930 –1959 (black curve), ii) 1960 –1989 (red curve) and iii) 1990–2019 (blue curve). It can be observed that the modern bridges perform slightly better than the bridges built 30 years ago. The median survival years of timber deck, superstructure and substructure components are obtained as: i) 8, 12 and 10 years respectively for bridges built during 1930 – 1959, ii) 10, 12 and 8 years for bridges built during 1960 – 1989, and iii) 11, 14 and 12 years for bridges built during 1990 – 2019. Overall, it can be observed that the modern timber bridges stay in their current condition without deterioration for at least an additional 2 years when compared to the bridges built 30 years ago. This performance improvement could be attributed to routine bridge inspection and maintenance conducted after the initiation of National Bridge Inventory system.
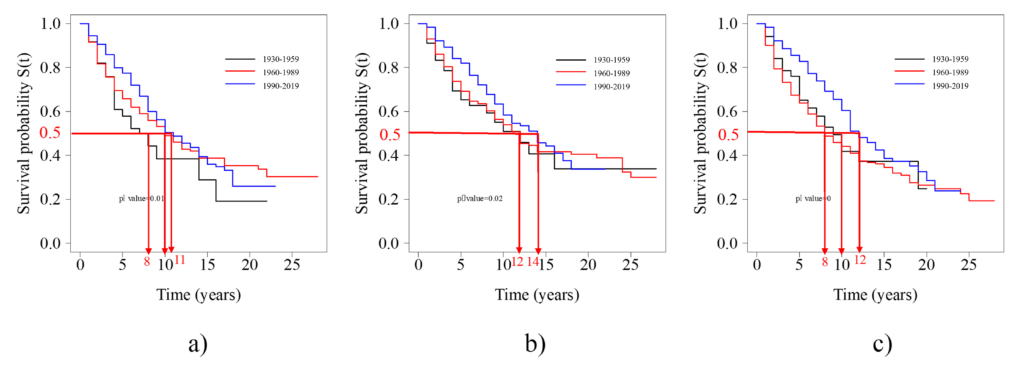
Figure 9: K-M models for Timber Highway Bridge Components based on the Year of Construction: a) Deck, b) Superstructure and c) Substructure
Significance of the Models
The significance of the ATICR and K-M models developed in the manuscript are: i) it accounts for non-stationarity in the deterioration process i.e. the deterioration rate varies as a function of time. It is a widely accepted fact that real-life deterioration processes are non-stationary in nature; ii) the models are nonparametric, i.e. there is no assumption on the functional form of the model. The models are developed solely based on the bridge inspection records; iii) the ATICR-based model provides a way to obtain the condition deterioration rates of bridge components useful for future condition prediction; iv) K-M models account for partial information from incomplete bridge inspection records. K-M models provide the simplest way of navigating through difficult situations like left-censoring, right-censoring and interval-censoring observed in bridge condition records without neglecting this information; v) the models are suitable for large scale bridge management applications.
Timber Railroad Vs. Highway Bridge Performance
Due to lack of availability of routine inspection records for railroad bridges, development of K-M survival models is not a feasible task. However, this paper suggests that the performance of timber trestle railroad bridges can be understood based on survival models developed for timber multi-beam highway bridges since: i) the bridges share a similar type of major superstructure and substructure components such as stringers, pile cap and piles; ii) the bridges are located in the same State (i.e. Florida) and hence are subjected to similar climatic conditions and iii) similar construction period is considered (i.e. 1930-1959). The key differences that can impact the performance levels between timber trestle railroad bridges and timber multi-beam highway bridges are loadings and maintenance levels. For example, timber railroad bridges are designed and rated based on AREMA Cooper E80 loads, however, the timber highway bridges are designed based on AASHTO LRFD HL-93 vehicular live loading. Assuming that the timber bridges are designed to provide a service life for at least 25-30 years without any major reconstruction, the loading levels may not have an impact on the survival probabilities of the stringer, pile cap and pile components. However, the maintenance levels should have an impact on the performance. For example, routine inspections and minor maintenance activities are conducted for the highway bridges. There is no sufficient publicly available information to mention that such activities are also conducted for all timber railroad bridges. Hence, it can be expected that the performance of modern highway bridges (built during the last 30 years) are perhaps better than the railroad bridges.
The superstructure condition ratings of the timber trestle railroad bridges at the time of field tests were 4 and 2 respectively for ballast deck bridge (age: 61 years) and open deck bridge (age:70 years) respectively. Although these are two different railroad bridges, objectively it can be seen that it took almost 9 years for deterioration from condition rating of 4 to 2, meaning that it takes approximately 4.5 years for deterioration from current state to a lower condition state. This corresponds to a survival probability of 70% based on the comparison with timber multi-beam highway bridge superstructure as shown in Figure 10. Similarly, it can be observed that there is a 80% probability that the timber railroad bridge superstructure would survive in its current condition state without deterioration for at least 3 years.
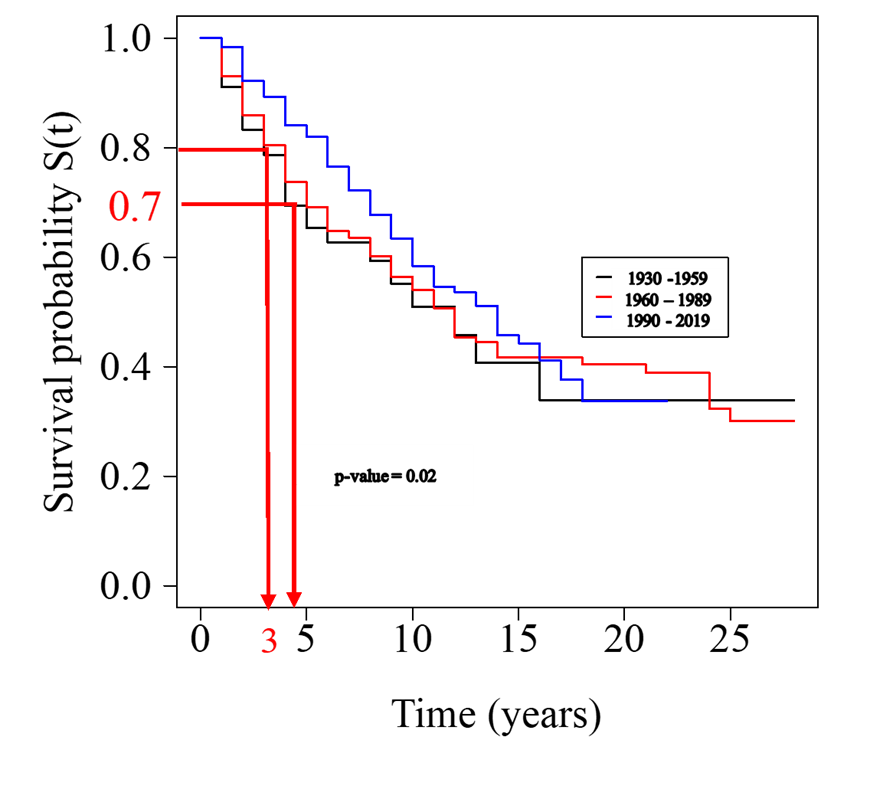
Figure 10: K-M Survival Models for Timber Bridge Superstructure (based on NBI data)
SUMMARY AND CONCLUSIONS
This paper investigated the performance of timber trestle railroad bridges through field tests on open deck and ballast-deck bridges originally built in 1948 and 1957 respectively. This study also developed non-parametric models to assess the performance of timber multi-beam bridge components based on visual bridge condition inspection data available in the National Bridge Inventory (NBI). Average Time In Condition Rating (ATICR)-based deterioration models are proposed in this study for predicting the condition of timber bridge components. Kaplan-Meier (K-M) estimate based reliability models are developed for probabilistic prediction of bridge safety which accounting for partial information from incomplete bridge condition observations.
The primary contributions and usefulness of this paper to the existing body of knowledge are: i) Performance assessment through field tests on two aging timber trestle railroad bridges in Florida; ii) Development of a systematic approach to obtain deterioration rates of bridge components based on Average Time In Condition Rating (ATICR); iii) Development of deterioration models based on ATICR for condition prediction; iv) Development of Kaplan-Meier (K-M) reliability models for Florida timber bridges for probabilistic prediction of bridge safety while accounting for partial information from the censored bridge condition observations.
The overall findings of the present study are:
- The maximum vertical deformations at the midspan of stringer due to moving train loads are obtained as 13 mm and 10 mm for the open deck bridge (with CSX freight train) and ballast-deck bridge (with Amtrak passenger train) respectively. These maximum vertical deformations exceeded the AREMA 2015 deflection limits of span/500. However, these deflections are well within the limits based on early 1900 design provisions.
- Based on the ATICR models developed in this study, it is observed that the deterioration rates are higher for condition rating from 5 to 4 compared to other cases such as from condition rating 7 to 6 or 6 to 5. This trend can be attributed to faster deterioration rate of older bridges.
- The average service life of timber multi-beam bridge components under routine maintenance without any reconstruction or rehabilitation is obtained as 23 years for decks, 26 years for the superstructures and 27 years for the substructure components. Here, service life refers to the time (in years) taken for the bridge condition to deteriorate from excellent/new condition to poor/advanced section loss condition (i.e. from condition rating 9 to 4).
- Based on the K-M reliability models, the Median Survival Year (MSY) which refers to the number of years for which 50% of the bridge population remains in its current condition without deterioration is obtained as 10 years for the decks, 14 years for the superstructures and 12 years for the substructures of timber multi-beam bridges.
- K-M models also suggest that there is 80% chance that the timber bridge components will remain in their current condition without deterioration to a lower condition for a minimum of 3 years.
- The modern timber bridges stay in their current condition without deterioration for at least an additional 2 years when compared to the bridges built 30 years ago. This performance improvement could be attributed to routine bridge inspection and maintenance conducted after the initiation of National Bridge Inventory system.
Future studies can be performed to consider multiple factors affecting the ATICR and reliability (i.e. survival probability) of timber bridge components such as the traffic loads, environmental conditions, and structure-related factors such as number of spans, span length, etc.
ACKNOWLEDGEMENT
The authors wish to thank and acknowledge the support of the Department of Civil, Geomatics and Environmental Engineering (CEGE), Florida Atlantic University, for the facility and support provided to carry out this study. Grateful acknowledgements are due to the support provided by the TRB Rail Safety 35 grant and CSX Transportation to carry out the field experiments for the timber trestle railroad bridges.
AUTHOR CONTRIBUTION STATEMENT
The authors confirm contribution to the paper as follows: study conception and design: I. Srikanth; data collection: I. Srikanth, M. Arockiasamy, S. Nagarajan; data analysis: I. Srikanth; interpretation of results: I. Srikanth, M. Arockiasamy; draft manuscript preparation: I. Srikanth. All authors reviewed the results and approved the final version of the manuscript.
REFERENCES
- Ritter, M. A. (1990), “Timber Bridges: Design, Construction, Inspection and Maintenance”, Washington, DC: U.S. Department of Agriculture, Forest Service, Engineering Staff.
- Wipf, Terry J., Ritter, M. A., and Wood, D. L. (2000). “Evaluation and field load testing of timber railroad bridge.” Proc., 5th Int. Bridge Engineering Conf., National Academy Press, Washington, DC,323–333.
- Srikanth I, Arockiasamy M, Nagarajan S. Comparison of Ratings of a 7-Span Open Deck Timber Trestle Railroad Bridge Based on As-Built Provisions and Current AREMA Guidelines. 2018.
- Ray, James C. and Stanton, Terry R. (1998), “Load Rating of Permanent Bridges on U.S. Army Installations”, Technical Report SL-98-3, U.S. Army Engineer Waterways Experiment Station, Vicksburg, Mississippi.
- Wipf, T. J. et. al. (1993), “Manual for Evaluation, Rehabilitation and Strengthening of Low Volume Bridges”, Iowa Department of Transportation, Report by College of Engineering: Iowa State University.
- Gutkowski, Richard M. (2001), “Field load tests on open-deck timber trestle railroad bridges”, Colorado State University.
- Gutkowski, Richard M. (2002), Full-Scale Laboratory Testing of a Timber Trestle Railroad Bridge Chord, Colorado State University.
- Moreu, F. al. (2014), “Dynamic Assessment of Timber Railroad Bridges Using Displacements”, Journal of Bridge Engineering, ASCE, ISSN 1084-0702/04014114(12).
- Nagarajan, S., Arockiasamy, M. and Spencer Jr, B., 2019. Non-contact Deflection Monitoring System for Timber Railroad Bridges (No. Rail Safety IDEA Project 35).
- American Railway Engineering and Maintenance-of-Way Association (AREMA), Manual for Railway Engineering .2015.
- Jacoby, Henry S. (1909), “Structural Details: Or Elements of Design in Heavy Framing”, John Wiley and Sons Inc., New York.
- Srikanth I, Arockiasamy M. Deterioration models for prediction of remaining useful life of timber and concrete bridges: A review. Journal of traffic and transportation engineering (English edition). 2020 Apr 1;7(2):152-73.
- Srikanth I, Arockiasamy M. Remaining Service Life Prediction of Aging Concrete bridges using Multiple Relevant Explanatory Variables. ASCE Practice Periodical in Structural Design and Construction. DOI: 10.1061/(ASCE)SC.1943-5576.0000604. 2021
- Srikanth I, Arockiasamy M. Integrated Probabilistic-Mechanistic Deterioration Modeling for Preventive Maintenance of Aging Fixed Offshore Jacket-Type Platforms. In International Conference on Offshore Mechanics and Arctic Engineering 2020 Aug 3 (Vol. 84331, p. V02BT02A030). American Society of Mechanical Engineers.
- Srikanth I, Arockiasamy M. Stochastic Time-Dependent Deterioration Models for Estimating Residual Service Life of Offshore Jacket-Type Platforms, In International Conference on Offshore Mechanics and Arctic Engineering 2021 June 28. OMAE2021-62919. American Society of Mechanical Engineers.
- Srikanth I. Stochastic Bridge Condition Deterioration Models for Concrete and Timber Bridges (Doctoral dissertation, Florida Atlantic University). 2021.
- Kaplan EL, Meier P. Nonparametric estimation from incomplete observations. Journal of the American statistical association. 1958 Jun 1;53(282):457-81.
- Beng, S. S., & Matsumoto, T. (2012). Survival analysis on bridges for modeling bridge replacement and evaluating bridge performance. Structure and infrastructure engineering, 8(3), 251-268.
- Goyal, R. (2015). Development of a survival-based framework for bridge deterioration modeling with large-scale application to the North Carolina bridge management system (Doctoral dissertation, The University of North Carolina at Charlotte).
- Fang, J., Ishida, T., & Yamazaki, T. (2018). Quantitative evaluation of risk factors affecting the deterioration of RC deck slab components in East Japan and Tokyo regions using survival analysis. Applied Sciences, 8(9), 1470.
- Wettach-Glosser, J. (2019). Concrete Bridge Deck Performance Data and Metrics for the State of Oregon.
- Stevens, N. A., Lydon, M., Marshall, A. H., & Taylor, S. (2020). Identification of Bridge Key Performance Indicators Using Survival Analysis for Future Network-Wide Structural Health Monitoring. Sensors, 20(23), 6894.
- Cardona, J., Romeu Garbí, J., Arcos Villamarín, R. and Balastegui Manso, A., 2010. A ground-borne vibration assessment model for rail systems at-grade. In 39th International Congress on Noise Control Engineering (pp. 1-10).
- Srikanth, I., & Arockiasamy, M. (2022). Development of Non-Parametric Deterioration Models for Risk and Reliability Assessments of Concrete and Timber Bridges. Journal of Performance of Constructed Facilities, 36(1), 04021114.
- Federal Highway Administration (FHWA). (1979). Recording and coding guide for structure inventory and apprasial of the nation’s bridges, U.S.
- Bolukbasi, M., Mohammadi, J., & Arditi, D. (2004). Estimating the future condition of highway bridge components using national bridge inventory data. Practice Periodical on Structural Design and Construction, 9(1), 16-25.
- Watt DC, Aitchison TC, Mackie RM, Sirel JM. Survival analysis: the importance of censored observations. Melanoma research. 1996 Oct 1;6(5):379-85.